


After facing its sharpest decline on record in 2020, U.S. travel spending rebounded sharply as pent-up demand drove consumers back to planes, cars, and hotels. According to the Bureau of Economic Analysis, consumer spending on domestic accommodations surpassed pre-pandemic levels in 2022 and reached record highs in both 2023 and 2024.
Amid this surge in demand, the number of hotel establishments nationwide continued to grow. While the industry experienced steep revenue losses during the pandemic, the total number of hotels remained relatively stable. Since then, hotel development has accelerated, with thousands of new properties opening across cities of all sizes. From major urban centers to smaller regional markets, many areas have seen a renewed wave of investment in the hospitality sector.
This analysis, conducted by Luxury Link—a luxury hotel booking platform—identifies the states and cities that have added the most new hotels since 2019, highlighting where the sector has expanded most significantly. For travelers, these locations may offer some of the best opportunities to find newly built or recently opened places to stay.
Trends in U.S. Hotel Growth & Employment
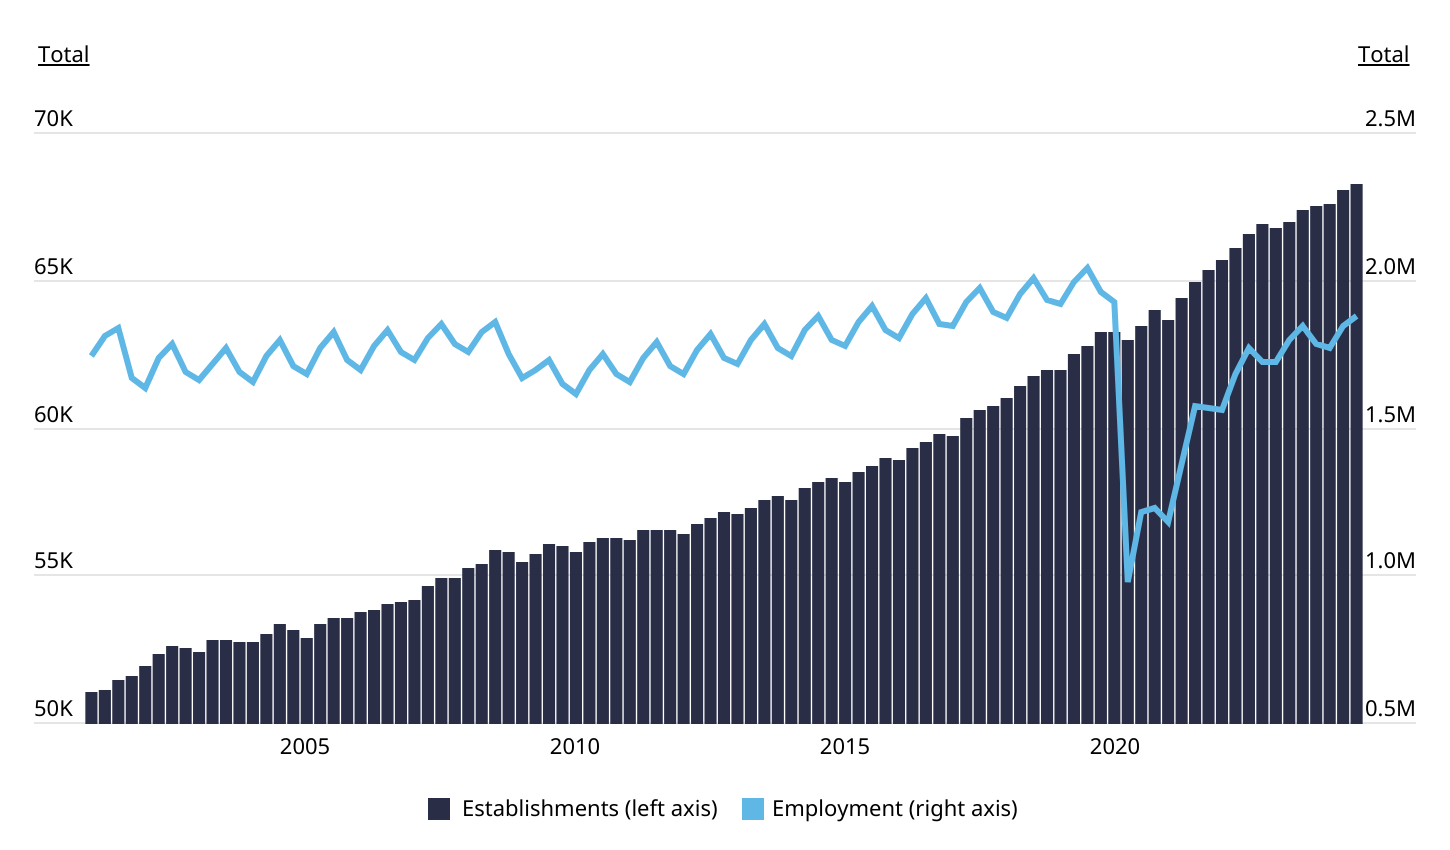
While the number of hotels continues to grow, employment still lags behind pre-pandemic levels
Source: Luxury Link analysis of BLS data
According to data from the U.S. Bureau of Labor Statistics (BLS), the number of hotel establishments in the United States has steadily increased over the past two decades, with only a brief slowdown during the early months of the COVID-19 pandemic. From 2001 to Q3 of 2024, the total number of hotel properties grew by more than 33%, rising from approximately 51,000 to over 68,000.
Employment, however, has not kept pace. After reaching a high of just over 2 million workers in mid-2019, hotel employment fell by more than 50% in the second quarter of 2020. Although these numbers have gradually recovered, they remain significantly below pre-pandemic levels. As of the third quarter of 2024, the hotel sector employed roughly 1.87 million workers—about 8% below its peak.
The lag in employment is not due to lack of demand but to persistent hiring challenges. Many hotel workers left the industry in 2020, and a significant number have not returned. Even as employers have raised wages and offered more flexible schedules, the industry continues to face labor shortages.
Hotel Growth by Type
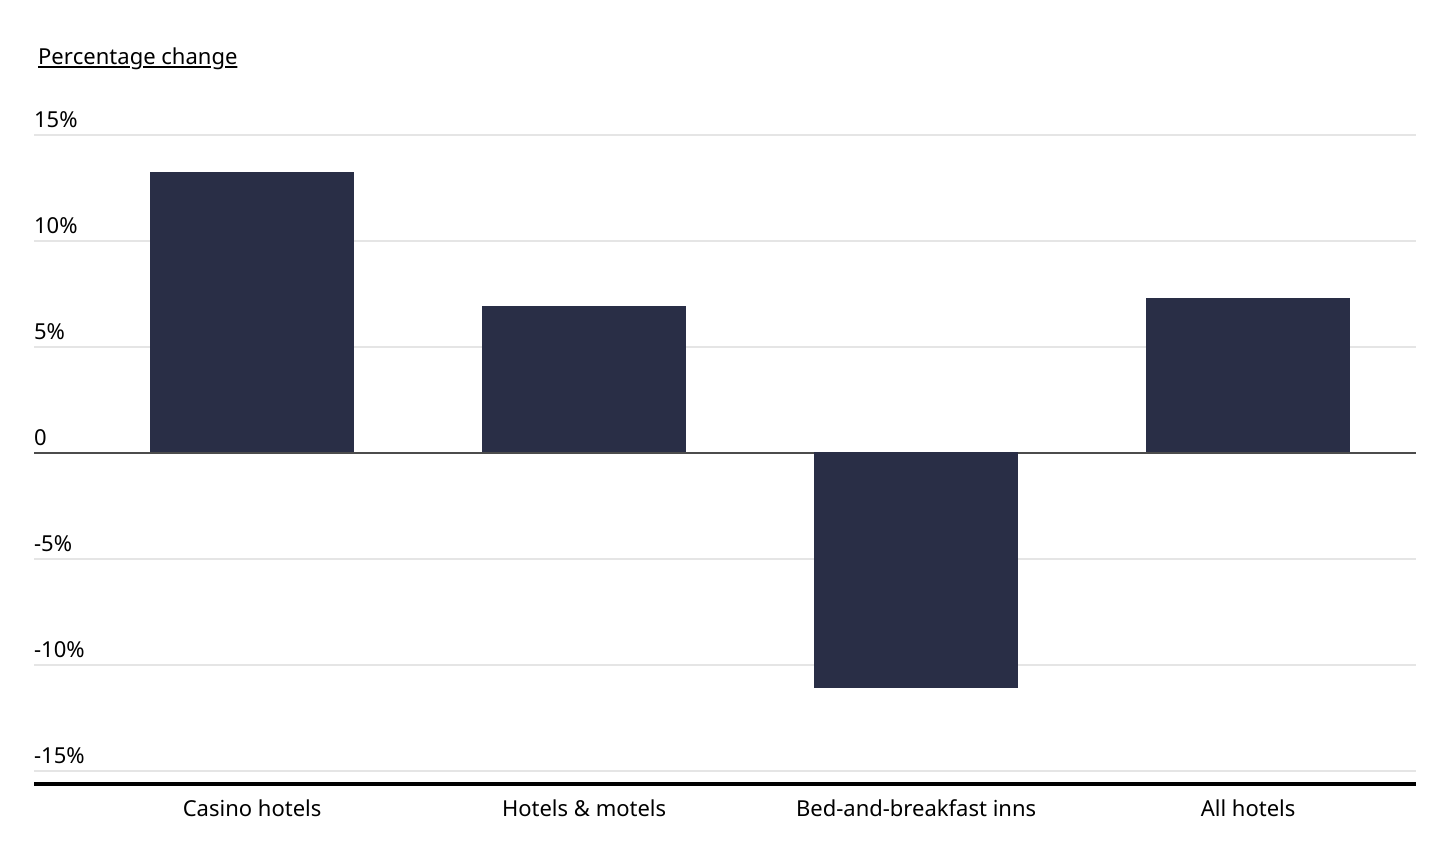
While large casino hotels have expanded, smaller accommodation types face challenges
Source: Luxury Link analysis of BLS data
While the overall number of hotel establishments in the U.S. has grown since 2019, not all types of accommodations have followed the same trajectory. Larger, full-service hotels—particularly casino hotels—have seen the most growth in relative terms. The number of casino hotels increased by 13.2% since 2019, the fastest rate among major hotel categories. This growth has been aided by the expansion of legalized gambling in several states, which has opened new markets for casino development.
Traditional hotels and motels also expanded steadily, growing by 6.9% over the same period. These properties make up the vast majority of the traveler accommodation sector, accounting for more than 91% of all hotels.
In contrast, smaller and more niche accommodations have faced headwinds. The number of bed-and-breakfast inns declined by 11.1% since before the pandemic. This drop suggests that many of these smaller, often independently operated establishments may have struggled to withstand COVID-19 disruptions or compete for workers with larger chains in the post-pandemic market.
Hotel Growth by Location
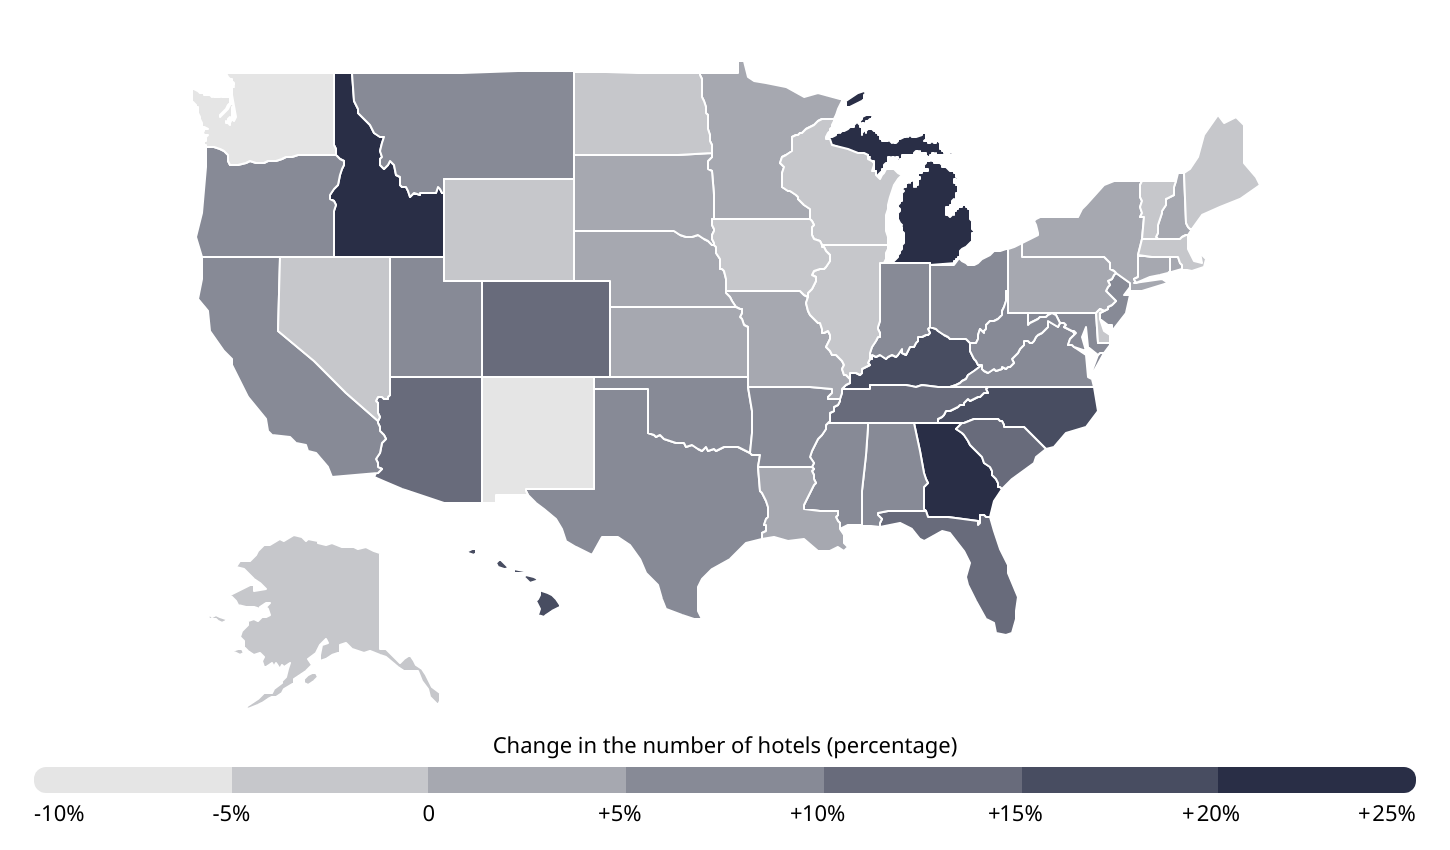
Michigan & Idaho have added the most new hotels since 2019
Source: Luxury Link analysis of BLS data
Regionally, hotel growth since 2019 has been strongest in the South, with additional hotspots in the Midwest and Mountain West. Michigan (+22.0%) and Idaho (+21.3%) recorded the highest percentage increases, followed closely by Southern states such as Georgia (+20.8%), Kentucky (+16.8%), and North Carolina (+16.6%). In total, 26 states experienced hotel growth of 5% or more, reflecting broad development beyond the country’s most established travel markets.
The Northeast recorded the slowest hotel growth of any U.S. region. While Mid-Atlantic states saw modest gains, New England was the only region to experience a net decline in hotels since 2019. Vermont (-1.2%), Massachusetts (-1.7%), and Maine (-4.3%) all reported losses, and the remaining New England states posted below-average growth. Outside the Northeast, Washington (-5.9%) and New Mexico (-6.0%) recorded the steepest declines across all states, making them the only two to see drops exceeding 5% over this period.
Similar trends hold at the local level. Among the nation’s largest metropolitan areas, the top five for hotel growth were located in Michigan, North Carolina, Georgia, and Kentucky. The Grand Rapids metro led all large metros with a 32.4% increase in hotels, followed by Charlotte (+24.0%), Raleigh (+23.6%), Atlanta (+22.0%), and Louisville (+21.7%). In contrast, four major metros with over one million residents saw net declines in hotel counts: Seattle (-6.2%), Hartford (-4.8%), Las Vegas (-3.1%), and Chicago (-0.4%).
For a complete breakdown of hotel growth across all 50 states and more than 370 metropolitan areas, see the original post on Luxury Link: U.S. Cities That Have Added the Most New Hotels.
Methodology

Photo Credit: Media Photos / Shutterstock
The analysis uses data from the U.S. Bureau of Labor Statistics’ Quarterly Census of Employment and Wages (QCEW), focusing on NAICS sector 7211, “Traveler Accommodation.” This sector includes hotels, motels, casino hotels, bed and breakfasts, and similar establishments. For clarity, all are referred to collectively as “hotels.”
The percentage change in the number of hotel establishments was calculated between 2019 (pre-pandemic) and 2023 (the most recent year with complete data). Where available, changes in employment within the hotel sector over the same period were included. However, employment figures are not published for all areas. In many cases, the BLS withholds data either due to high sampling error or to avoid disclosing information about specific employers.
To improve the comparability of the results, metropolitan areas were grouped by population: small (under 350,000), midsize (350,000 to 999,999), and large (1 million or more).
For complete results, see U.S. Cities That Have Added the Most New Hotels on Luxury Link.