


Widespread interest in exercise and gym culture is a relatively recent phenomenon in the United States. While physical activity has always been part of daily life in some form, it wasn’t until the 1970s that going to the gym became a mainstream pursuit. Influenced by cultural icons like Jane Fonda and Arnold Schwarzenegger, and fueled by the rise of aerobics and strength training, the fitness movement began to take hold across the country.
Though the COVID-19 pandemic temporarily disrupted in-person workouts and led to a surge in at-home fitness, the popularity of gyms and other recreational fitness centers has since rebounded and continues to grow. Today, these facilities play a crucial role in how many Americans pursue health and wellness, with access to them often correlating with better health outcomes.
To explore these dynamics in more detail, researchers at Cinch—a company that provides marketing software for gyms—analyzed the latest data from the Bureau of Labor Statistics (BLS) and the Centers for Disease Control and Prevention (CDC). They examined how the number of gyms has grown nationwide, identified regional differences in the concentration of fitness centers, and evaluated how gym access correlates with key health indicators across the U.S.
Interest in Gym Memberships Is Growing
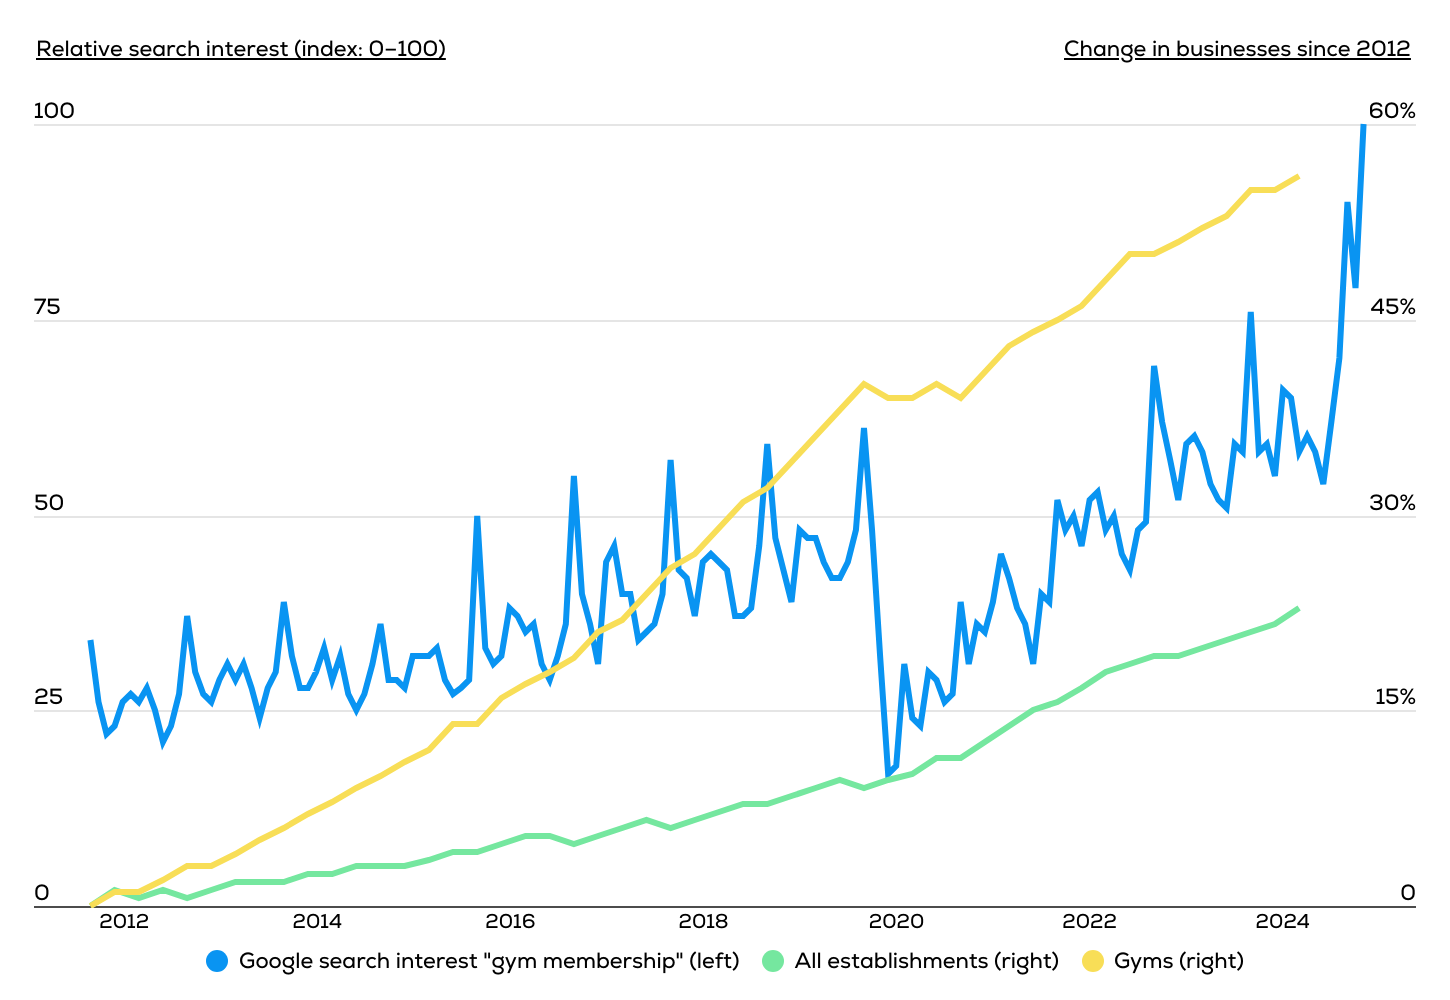
Source: Cinch analysis of Google Trends data
Public interest in gyms has continued to grow steadily in recent years, a trend reflected in both online search behavior and the expansion of fitness-related businesses. According to Google Trends data, searches for “gym membership” in the United States have risen consistently since 2012, peaking sharply in early 2025. While there was a notable dip in interest during the early months of the COVID-19 pandemic, searches rebounded and surpassed pre-pandemic levels by 2022.
This interest is also highly seasonal. Gym-related searches tend to spike each January and June—the former coinciding with New Year’s resolutions and the latter aligning with the approach of summer, when many people become more focused on fitness and appearance. Despite this seasonality, the long-term growth of fitness-related establishments has significantly outperformed that of private businesses overall. Since 2012, the number of gyms in the U.S. has risen by approximately 56%, compared to a 38% increase in total private establishments. This trend indicates a sustained and growing national interest in health and wellness that has outpaced other sectors of the economy.
States & Metros With the Most Gyms per Capita
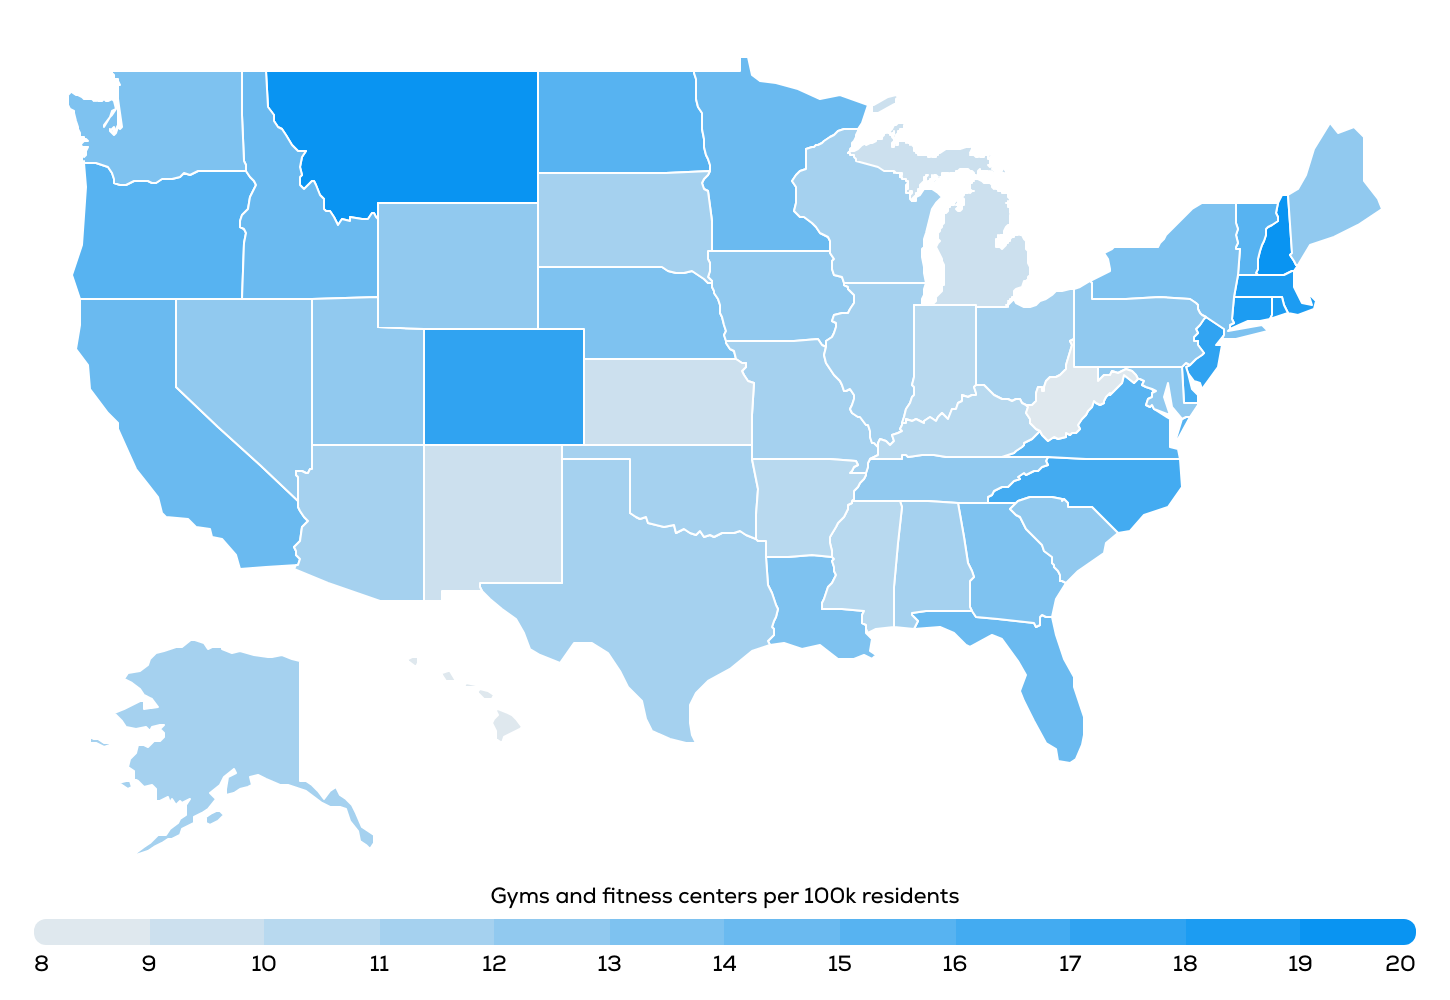
Source: Cinch analysis of BLS data
Access to fitness centers varies significantly by geography, with some regions offering far more options for its residents than others. Regionally, the Northeast leads the nation with an average of 15.1 gyms per 100,000 residents, followed by the West (14.0), South (13.0), and Midwest (11.3). These differences reflect a combination of cultural attitudes toward fitness, lifestyle preferences, levels of urbanization, and market demand for wellness services.
Among the top-ranking states, several Northeastern locations stand out, including New Hampshire, Connecticut, Massachusetts, and Rhode Island, all of which report more than 18 gyms per 100,000 residents. Montana, despite its largely rural character, ranks first overall at 19.7 gyms per 100,000—suggesting a strong fitness culture relative to its population size. Other high-ranking states include Colorado, New Jersey, and North Carolina.
In contrast, states at the lower end of the list tend to cluster in the Midwest and parts of the South. West Virginia, Hawaii, and Michigan have the fewest gyms per capita, each with 9 gyms per 100,000 residents or fewer. These areas may face a range of barriers to access—from geographic spread and lower population density to differing health priorities or limited demand for commercial fitness services.
Metro-level trends closely reflect state-level patterns. Major cities like Raleigh and Charlotte in North Carolina, Boston in Massachusetts, and Denver in Colorado rank among the top large metropolitan areas for gym density, each with more than 19 gyms per 100,000 residents. However, the highest concentration of gyms is found in Bridgeport, Connecticut, where there are 28.5 gyms per 100,000 residents—more than twice the national average.
A Strong Correlation Between Fitness Centers & Health
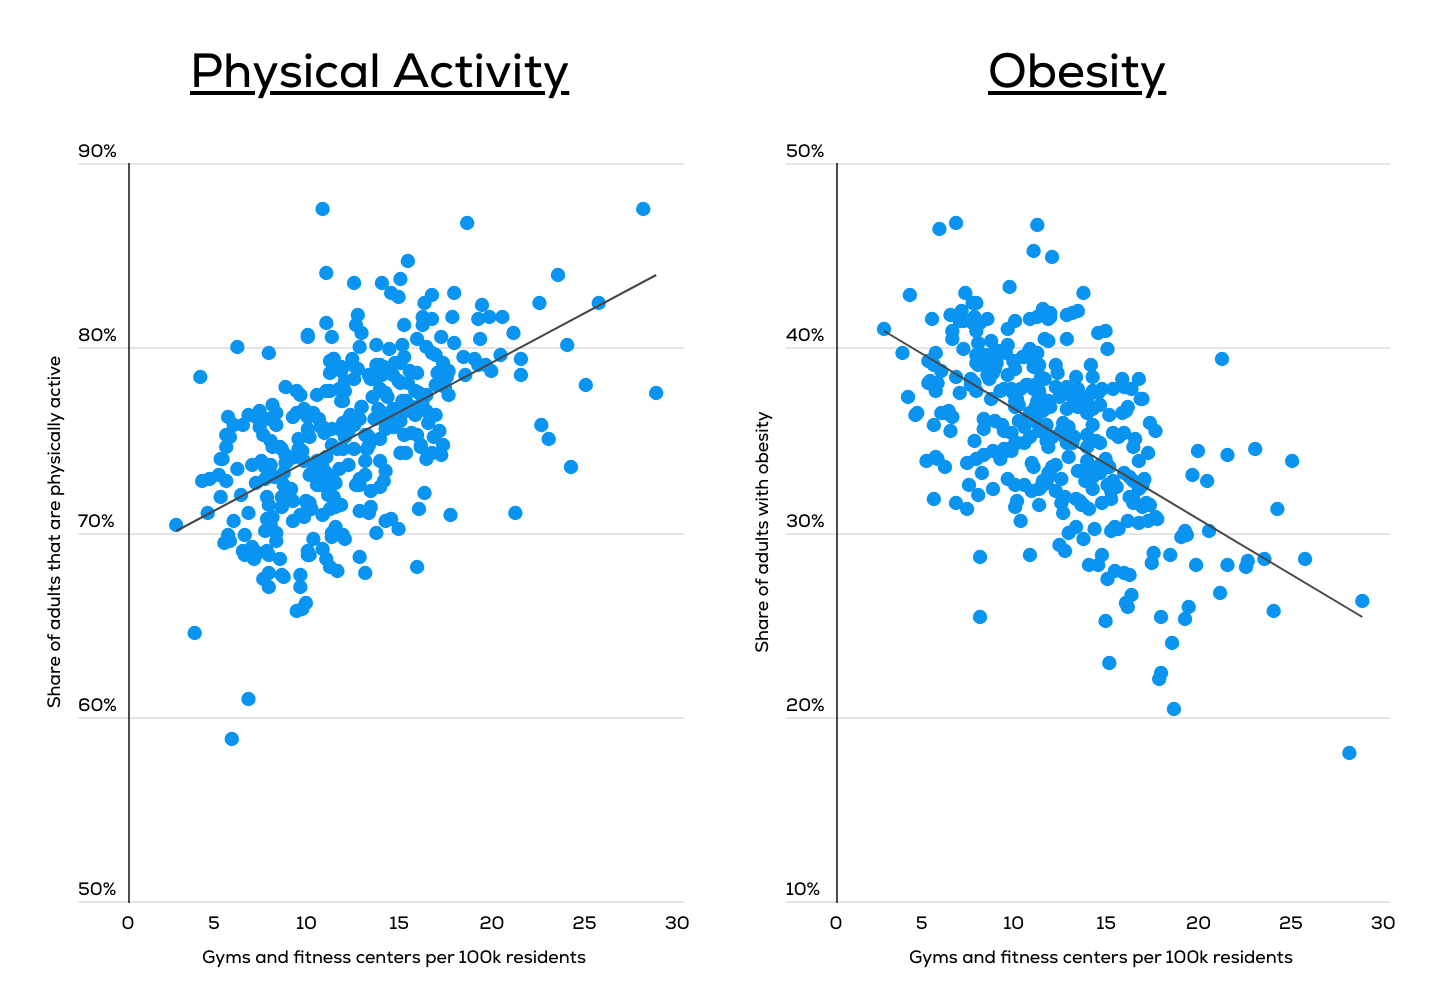
Source: Cinch analysis of BLS and CDC data
Across U.S. metropolitan areas, there is a strong link between the availability of fitness centers and key health outcomes tracked by the CDC. Cities with higher concentrations of gyms tend to report higher levels of physical activity, lower rates of obesity, and better overall health. Nationally, there are about 13.2 gyms per 100,000 residents, with 76.3% of adults considered physically active and 33.3% classified as obese. But in places with greater access to fitness centers, those figures are significantly better.
Boulder, Colorado stands out as a national leader on all fronts. It not only has the second-highest density of gyms, but also leads the country in physical activity (87.5%) and reports the lowest obesity rate (18.0%). Nearby Fort Collins reports similar statistics, with a high concentration of gyms (18.3), one of the highest rates of physical activity (86.8%), and a low obesity rate of 20.4%.
The reverse pattern is also evident. Several metros in Texas, West Virginia, and Arkansas report below-average access to gyms, paired with higher obesity rates and lower levels of physical activity. For example, Corpus Christi, Texas has fewer than 10 gyms per 100,000 residents, with only 65.8% of adults physically active and an obesity rate exceeding 43%. In Beckley, West Virginia and Fort Smith, Arkansas, similar dynamics play out—fewer gyms, less exercise, and significantly higher obesity rates than the national average.
For complete results on all 50 states and more than 340 metros, see the original post on Cinch: America’s Fitness Capitals: Cities With the Most Gyms per Capita.
Methodology

Photo Credit: SORN340 Studio Images / Shutterstock
This study draws on data from two primary sources: the U.S. Bureau of Labor Statistics (BLS) Quarterly Census of Employment and Wages (QCEW) and the U.S. Centers for Disease Control and Prevention (CDC) PLACES: Local Data for Better Health dataset. The most recent data available from each source was used—2023 annual averages from the BLS and the 2024 data release from the CDC.
To identify the cities and states with the highest concentration of gyms, researchers calculated the number of establishments classified under “Fitness and Recreational Sports Centers” (NAICS code 71394) per 100,000 residents. These figures represent gym density on a per capita basis; they only include gyms with paid employees.
For additional context, relevant public health statistics were incorporated from the CDC PLACES dataset. These include:
- Physical activity rate: The percentage of adults aged 18 and over who reported engaging in physical activity (e.g., running, golf, calisthenics) outside of work in the past month.
- General health status: The share of adults who self-reported their overall health as “good,” “very good,” or “excellent.”
- Obesity rate: The percentage of adults with a body mass index (BMI) of 30.0 kg/m² or higher.
Health indicators reflect crude prevalence rates for adults aged 18 and over, aggregated from county-level estimates to the metropolitan and state level. Only metropolitan areas with complete data across all variables were included in the final analysis. Additionally, metros were grouped into three cohorts based on total population:
- Small metros: 100,000 to 349,999 residents
- Midsize metros: 350,000 to 999,999 residents
- Large metros: 1,000,000 residents or more
For complete results, see America’s Fitness Capitals: Cities With the Most Gyms per Capita on Cinch.